Capacity Analysis Able Analyze Plant Equipment Capacity Automation Essential Understanding Q30758932
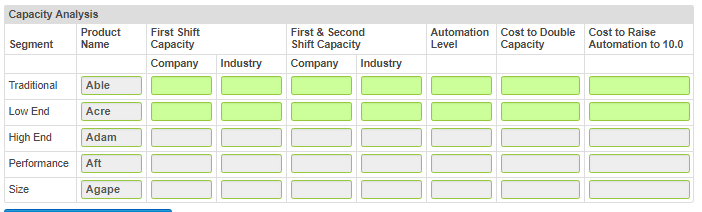
Capacity Analysis
Being able to analyze plant and equipment (capacity andautomation) is essential to understanding how you and yourcompetitors are supplying the market demand. There is often unmetdemand in segments because companies do not or cannot produceenough units. If you successfully analyze industry capacity, yourteam could benefit from these shortfalls.
Each product has its own production line where you can setcapacity and automation. Capacity represents the company’s abilityto produce units of its product. Think of capacity as yourmanufacturing plant. For each unit of capacity, there are twoshifts of workers that can use your manufacturing plant to produceyour products, which represents a first and second shift. So ifyour product has a capacity of 1000, this means you can produce upto 2000 units of your product.
Automation represents the robot-to-worker ratio in yourmanufacturing plant. A higher ratio of robots will provide yourcompany with a lower labor cost. However, this will increase theamount of time it takes your products to be updated.
You will need:
The Production Analysis report (page 4) of the CapstoneCourier for Round 0
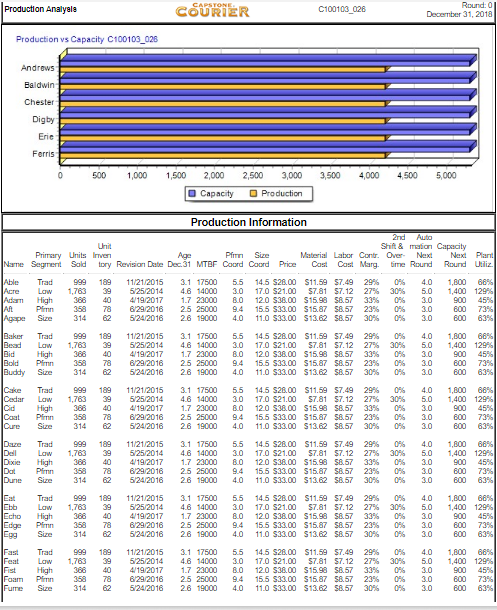
On the Production Analysis page, look at the table of products(the Andrews company is displayed below). The highlighted boxes(plus a little math!) are where you will find the information youneed to complete the analysis.
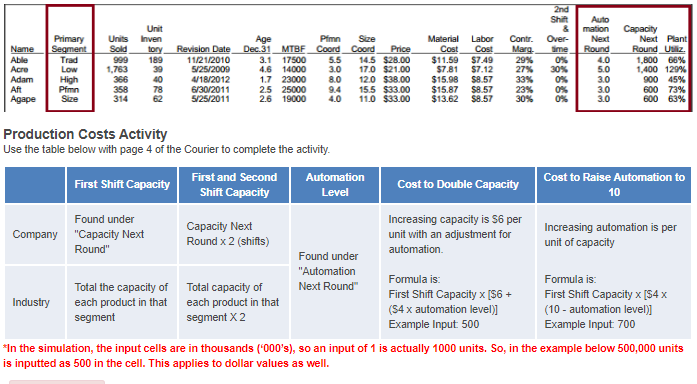
Production Analyala COURIER C100103 026 December 31, 2018 Production vs Capacity C100103028 Androws Ealdwin Chester Digby Erie Ferris 500 1,000 1,500 2,000 2,500 3,000 3,500 4,000 4500 5,000 Capacity Production Production Informationn 2nd Auto Shift & maion Capsscity Unni Primary Units Iven Material Labor Cont. Over- NexNex Pant Nerne Segment Sold tory Revision Dete Dec.31 MITBF Coord Coord Price Cast Cast Marg- time Rourd Rurduǐz. Age Pfim Size Able Trad 189 11/21/2015 3.1 17500 5.5 14.5 S28.ㆀS11.59$7.49 2956 0% 4.0 1,800 66% Acre Law 1,763 39 525/2014 4.614000 30 17.0 S21.00 S7.81$7.12 27% 30% 50 1,400 129% Adam High 366 40 419/2017 1.723000 8.0 120 S38.00 S15.98S8.57 33% 30 900 45% 600 73% Appe Size 314 62 524/2016 2619000 4.0 11.0 s3300 s13.62s857 30% 056 3.0 600 63% Aft Pmn 358 78 629/2016 25 25000 9.4 15.5 S33.00 S15.87 S8.57 23% 0% 3.0 Baker Trad 189 11/21/2015 3.117500 5.5 14.5 S28.00 S11.59$7.49 29% 0% 4.0 1.800 66% Beisd Low 1,763 39 5252014 4.614000 30 17.0 S21.00 S7.81$7.12 27% 30% 50 1.400 129% Bid High 40 419/2017 1.7 23000 8.0 120 S3800 S15.98S&57 33% 0% 30 900 45% 600 73% Buddy Size 314 62 5242016 2.6 19000 4.0 11.0 s3a00S13.62S8.57 30% 0% 3,0 600 63% Bold Phmn 358 78 629/2016 2525000 9.4 15.5 s33.00 s15.87s8.57 23% 056 3.0 Cake Trad 999 189 11/21/2015 3.117500 55 14.5 S28.00 S11.99$7.49 29% 0% 4.0 1,80066% Cedar Low 1,763 39 5252014 4.614000 30 17.0 S21.00 S7.81$7.12 27% 30% 50 1.400 129% Cid High 366 40 419/2017 1.7 23000 8.0 120 S3800 S15.98S&57 33% 0% 3.0 900 45% 600 73% are Size 314 62 5242016 2.6 19000 4.0 11.0 s3a00S13.62 $0.57 30% 0% 3,0 600 63% Caat Pmn 358 78 629/2016 25 25000 9.4 15.5 S30.00 S15.87 S8.57 2ฐ% 056 3.0 Due Trad 999 189 11/21/2015 3.1 17500 55 14.5 S28.00 S11.59$749 29% 0% 4.0 1.80066% Dell Low 1,763 39 525/2014 4.614000 30 17.0 S21.00 S7.81$7.12 27% 30% 50 1,400 129% Dixie High 40 419/2017 1.723000 8.0 120 S3800 S15.98S&57 33% 0% 3.0 900 45% 600 73% Dane Size 314 62 524/2016 26 19000 4.0 11.0 S33.00$13.62 $0.57 30% 0% 3,0 600 63% Dat Pmn 358 78 629/2016 2525000 9.4 15.5 S3300 S15.87 S8.57 23% 056 3,0 Eat Trad 999 189 11/21/2015 3.117500 55 14.5 S28.00 S11.99$7.49 29% 0% 4.0 1,80066% Ebb Low 1,763 39 5252014 4.614000 30 17.0 S21.00 S7.81$7.12 27% 30% 50 1.400 129% Echo High 40 419/2017 1.723000 8.0 120 S3800 S15.98S&57 33% 0% 30 900 45% 600 73% Egg Size 314 62 524/2016 2619000 4.0 11.0 S3300 S13.62S&57 30% 0% 30 600 63% Edge Pmn 358 78 629/2016 25 25000 9.4 15.5 S33.00 S15.87S&57 23% 056 3.0 Fast Trad 999 189 11/21/2015 3.1 17500 55 14.5 S28.00 S11.99$749 29% 0% 4.0 1.80066% Feat Law 1,763 39 5252014 4.614000 30 17.0 S21.00 S7.81$7.12 27% 30% 50 1.400 129% Fist High 366 40 419/2017 1.7 23000 8.0 120 S3800 S15.98S&57 33% 0% 3.0 900 45% 600 73% Furne Size 314 62 524/2016 26 19000 4.0 11.0 S33.00$13.62 $0.57 30% 0% 3,0 600 63% Foam Pmn 358 78 629/2016 2525000 9.4 15.5 s3300 s15.87 s8.57 23% 056 3.0 Show transcribed image text

Leave a Reply
Want to join the discussion?Feel free to contribute!